
Before you trade, you need to understand how to read a chart. Everything starts with Japanese candles.
What a Candle Shows
Each candle shows 4 prices over one period:
- Open — opening price
- Close — closing price
- High — maximum price
- Low — minimum price
- 💚 Green candle = price moved up
- ❤️ Red candle = price moved down
- Wicks = price moved outside the candle body
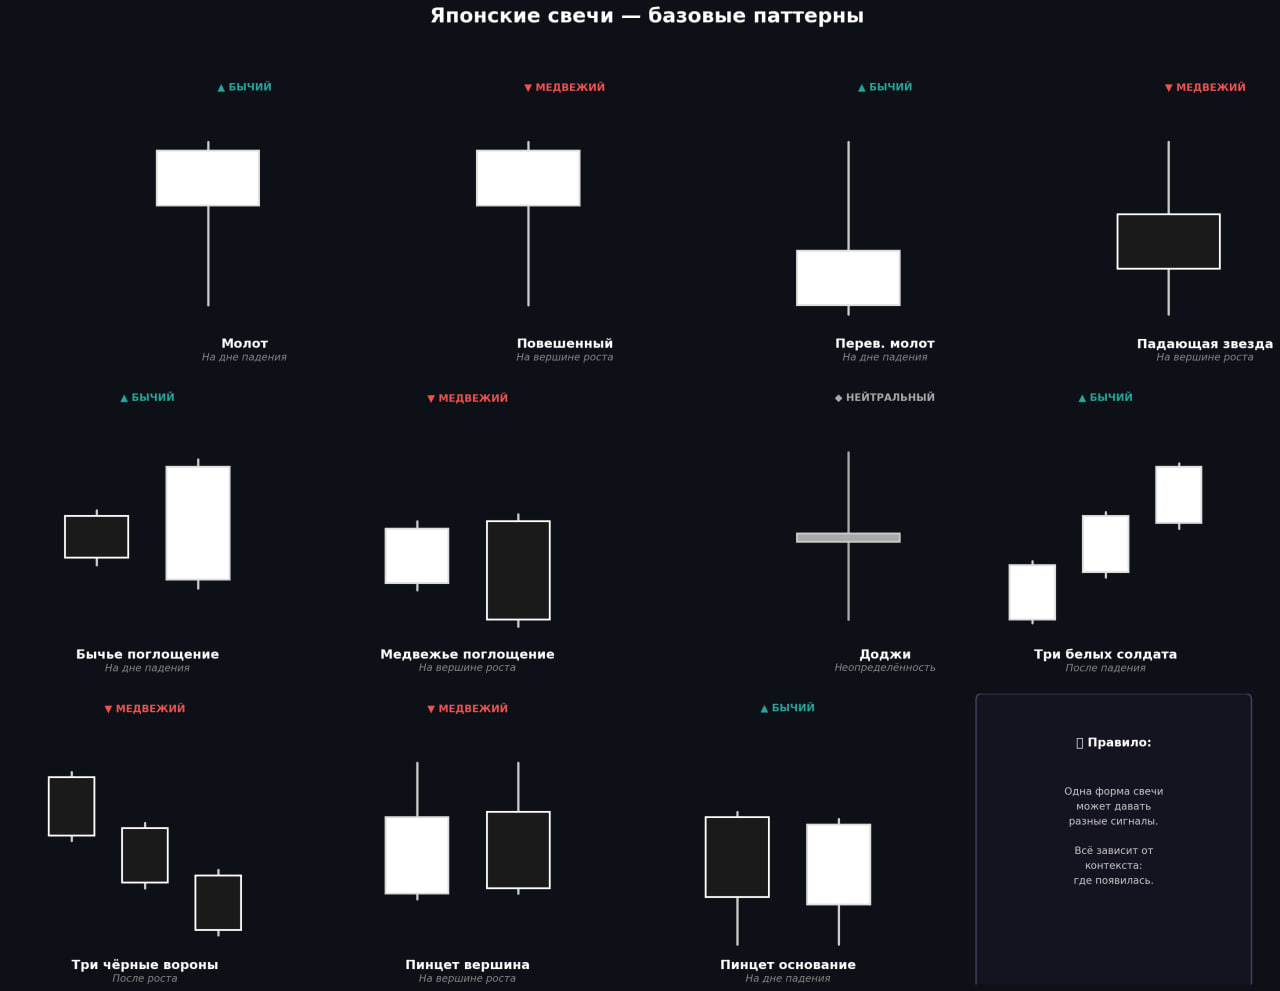
Core Patterns
Candlestick patterns are candle combinations that often appear before reversal or continuation. But remember: context decides everything.
Hammer and Inverted Hammer
🔨 Hammer
Small body + long lower wick (2-3 times the body). Appears near the bottom of a downtrend.
Signal: buyers rejected the drop → upward move is possible.
🙃 Inverted Hammer
Small body + long upper wick. Also appears at the bottom. Weaker than a classic hammer — needs confirmation by the next candle.
Hanging Man and Shooting Star
😵 Hanging Man
Looks like a hammer but appears at the top of an uptrend. Signal: possible reversal down. Same look as hammer — context is critical.
⭐️ Shooting Star
Small body + long upper wick. Appears at trend highs. Signal: sellers rejected growth → decline is possible.
Engulfing and Doji
📈 Bullish Engulfing
A large green candle fully engulfs the previous red one. Appears at the bottom. Signal: buyers took control.
📉 Bearish Engulfing
A large red candle fully engulfs the previous green one. Appears at the top. Signal: sellers took control.
➕ Doji
Almost no body (open ≈ close). Neither side won = indecision. Often appears before reversals.
Three Soldiers and Three Crows
- 💂 Three White Soldiers — three green candles after a decline, each closing above the previous one. One of the strongest bullish reversal signals.
- 🦅 Three Black Crows — three red candles after growth. Strong bearish reversal signal.
- 🔧 Tweezer (top/bottom) — two candles with equal highs (tweezer top) or equal lows (tweezer bottom). Reversal signal. Rare, but useful.
Main Rule
⚠️ A pattern is only a hypothesis, not a guarantee.
A hammer in the middle of a trend works worse than a hammer at a key level. The goal is not to predict every trade, but to stay profitable over distance.
Summary
Japanese candles are the first tool to master. They show not just price, but the struggle between buyers and sellers.
- Each candle = 4 prices for one period
- Patterns work better near levels and in trend context
- A single pattern without context is noise