
Open a chart and don’t understand where the price will go? Support and Resistance Levels is the first tool that begins to provide answers.
What are levels
Think of the market as an elevator in a building. There are floors where he stops most often. The price works the same way - it does not move chaotically, it returns to the same zones again and again.
- Support is the “floor.” The level from which the price bounces upward. There are more buyers than sellers - they keep the price from falling.
- Resistance is the “ceiling”. The level from which the price turns down. There sellers are stronger - they put pressure on the price.
How to find a level
❓ 3 simple rules:
-
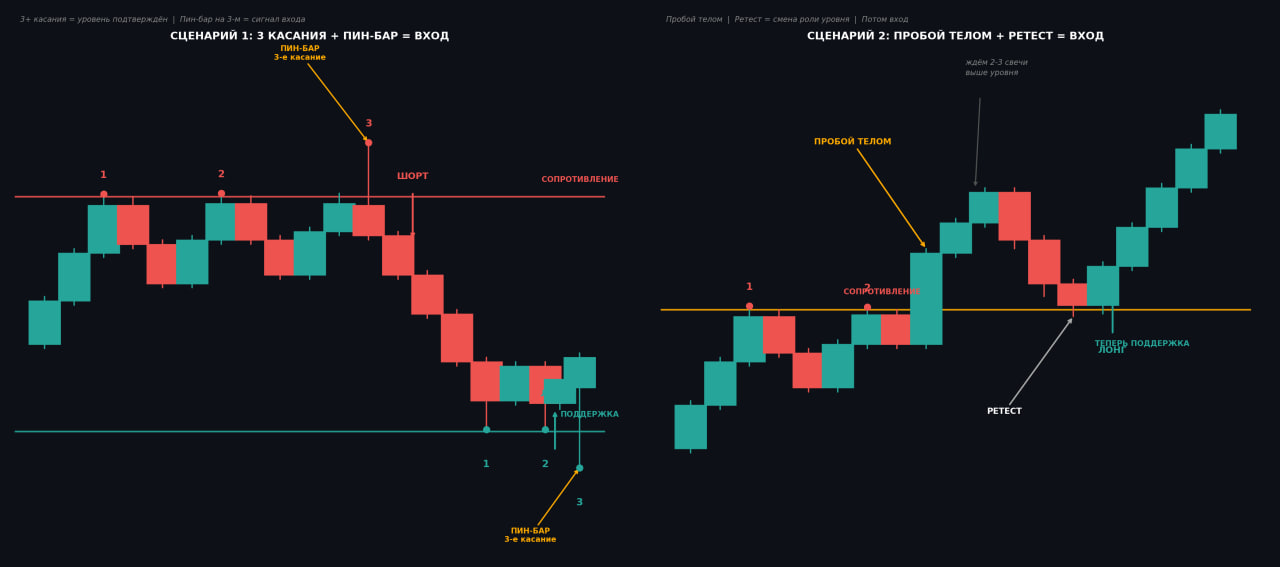
Minimum 2-3 touches. If the price stops at $80 once, this is an accident. If you stop three times, this is a level. The more touches, the stronger the zone.
-
Breakdown by the body, not by the shadow. The shadow of the candle went beyond the level and returned - the level remained stable. Only the closing of the candle body behind the level is counted. We already covered this in the lesson about structure - the same principle.
-
Round numbers work. $80, $100, $2000, $50,000 - round numbers have huge orders from big players. The level next to the round number is stronger.
Changing the role of a level
🔄Support becomes resistance - and vice versa
This is one of the most important principles. If the price stayed above $2000 for a long time, and then broke through it downwards, the same level of $2000 will now become resistance. The price will return to it from below and, most likely, will rebound downwards.
Why? Those who bought for $2000 are now at a loss. When the price returns to their entry point, they will be happy to break even. This creates selling pressure right at the level.
Such levels are the most valuable. Mark them separately.
How to trade from levels
Found the level - this is not a signal yet. The main rule: do not enter by touch, wait for confirmation. Because the levels are breaking through. Sometimes the price pretends to have fought back and continues moving further. Confirmation filters this out.
Rebound from level
The price has approached the level → wait for a reaction → see confirmation → enter in the opposite direction.
What is considered confirmation:
- Candlestick with a long shadow (pin bar) - the price went beyond the level, but returned and closed higher/lower
- Absorption - a large candle overlapped the previous one
- Several candles in a row cannot break through the level
Example: SOL approached the support of $76 → a pin bar appeared → only after that you open a long position, and not before.
Breakdown and retest
The price broke through the level with the body of the candle → waited for it to consolidate (2-3 candles above/below) → the price returned to the broken level (retest) → enter in the direction of the breakout.
Example: ETH broke through the $2147 resistance upwards → returned to $2147 → the former resistance is now support → go long.
Why retest, and not immediately at the breakout? Because there are a lot of false breakouts. A retest provides confirmation that the level has indeed changed its role.
Main mistakes
⚠️ Main mistakes:
- Log in immediately upon touching the level, without confirmation
- Draw 10–15 levels instead of 3–4 key levels
- Do you trust a shadow breakout - you need a body
- Ignore the timeframe - the 15M level and the 1D level are different weight categories
Which timeframe to search on
- 1D → global levels, the price respects them for months
- 4H → local levels, valid for 1–3 weeks
- 1H → tactical, to clarify entry
The logic is simple: first 1D - you see the big picture. Then 4H - you see where the price is now. Then 1H - looking for an entry point. Never the other way around.
Practice
Complete before moving to the next lesson:
Summary
- Level = zone where the price reacted at least 2–3 times
- Do not enter by touch - wait for confirmation
- Broken support becomes resistance
- 3 strong levels are better than 15 weak ones