
The levels are top. But professionals work not with lines, but with zones. Because the market does not bounce off the pixel - it reacts to the area where there was previously a large accumulation of orders.
What are zones
- Demand Zone - an area on the chart where buyers were so strong that the price sharply flew up. There are unfulfilled orders of large capital left here.
- Supply Zone - an area where sellers put pressure on the price and it fell sharply downwards. There are still unclosed positions of sellers here.
The logic is simple: if the price once sharply flew out of this zone, it means there were huge orders there. When the price returns, these orders will work again.
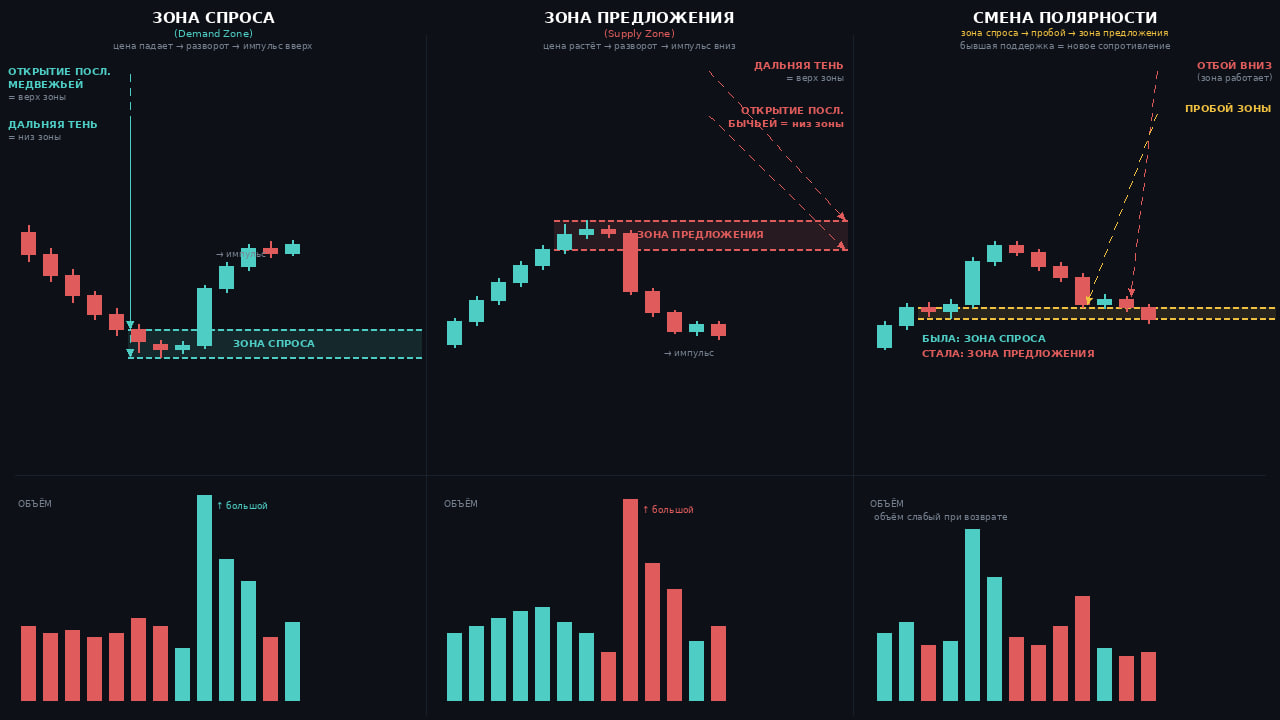
What the zone looks like
Demand zone: the price went down for a long time → sharp reversal upward → strong impulse. The base of this reversal is the demand zone. Mark it as a rectangle from the beginning to the end of the reversal candle.
Supply zone: the price went up for a long time → a sharp reversal downward → a strong downward impulse. The top of this reversal is the supply zone.
The zone width is usually 1–3 candles. Not a line, but a rectangle.
4 main situations
📌 How to read zones:
1. The price returns to the demand zone
The first return to the zone after a strong upward impulse is an entry. Krupnyak placed buy orders here. He's waiting.
2. The price returns to the supply zone
The first return to the zone after a strong downward impulse is a downward reversal. Vendors are reactivated.
3. The zone worked - lost its power
If the price entered the zone, the orders were processed and the price left - the zone weakened. Trust her less the next time you return. The fresh zone is always stronger than the spent one.
4. Zone + high volume on impulse
Remember Lesson 6 about volume? If the impulse from the zone was on high volume, the zone is very strong. This is where the big man stood with real money.
How does a zone differ from a level?
Level is a line. The price either reached or it didn’t.
A Zone is an area. The price may enter the middle of the zone and already begin a reversal.
This is why traders with levels often get a stop - the price almost reached the line. And those who work with zones are already in position, because the entry was taken along the upper border of the zone.
The zones also change their role: the former supply zone after a breakout becomes a demand zone. The former demand zone after the breakout becomes a supply zone.
Main rule
Look for fresh zones - those to which the price has not yet returned after an impulse. The faster and stronger the flight from the zone was - the more orders remained there - the stronger the reaction upon return.
Filter zones based on what you already know:
- Demand zone + hammer candle + high volume → the strongest buy signal
- Supply zone + absorption + low volume on breakout → false breakout, downward reversal
Three instruments together: zone + candle + volume = entry with high probability.
How to draw correctly
✏️ Two rules:
Demand Zone (Buy):Find the last bearish candle before the upward impulse. The upper boundary of the zone is the opening of this candle. The lower border of the zone is the longest downward shadow among the base candles. Draw a rectangle between these two points.
Supply Zone (Sell):Find the last bullish candle before the downward impulse. The upper boundary of the zone is the longest upward shadow. The lower border of the zone is the opening of this candle. Draw a rectangle between these two points.
Main rule: A zone is not a line, it is a rectangle. The price does not bounce off the pixel, it reacts to the area.
Practice
Complete before moving to the next lesson:
Summary
- A zone is an area, not a line
- Fresh zones are stronger than spent ones
- Momentum + high volume = strong zone
- Zone + candle + volume = full signal