
The main goal of this article is not to learn how to guess the top of a pump, but to build your entry in advance so that a rare stop doesn't wipe out the profit from a series of working signals.
Before you read
This is the third part of the AXON Dump Radar guide.
- Article 1 — how to read AXON Dump Radar signals: zones, prices, take-profits, SL, and validity window.
- Article 2 — how to enter signals: risk, notional, margin, leverage, and limit orders.
- Current Radar stats — in the Statistics section.
This article shows my working models for signal execution and risk management. It is not a promise of returns or individual investment advice.
Important. I don't know your deposit size, leverage, experience, or acceptable drawdown. The decision to open a trade, position size, margin type, scale-ins, SL, and profit-taking is yours alone, at your own risk. Leveraged futures trading can lead to partial or full loss of allocated margin. Past Radar statistics do not guarantee future results.
The big problem doesn't start with the bot stop
Most Dump Radar losses become painful not because the SL itself is too far. The problem appears earlier: the trader sees a signal, opens the full size with one click in the lower part of the zone, and leaves themselves ten or more percent of movement against the position.
With AXON Dump Radar, the stop is the boundary after which the short idea is no longer valid. The bot needs it for unified statistics and a clear scenario cancellation. That doesn't mean every participant must open full size at once and hold from the first price all the way to that level.
I trade differently: I split one total risk across several entries in advance. If the token drops immediately, the position is already open. If the pump continues, the main size is scaled in higher, the average entry rises, and the distance to the overall SL shrinks.
Below are four models. The first two work practically mechanically off a ready signal. The third limits the first failed attempt. The fourth is for those willing to skip fast dumps in exchange for entry only from the upper part of the range and confirmation through Ticker Analyzer.
When Radar sends a signal, it has already checked its own set of conditions. So the base strategy doesn't need to turn into twenty minutes of manual analysis. Ticker Analyzer is needed when you return to a signal later or consciously use a selective strategy.
Shared math for all strategies
For the examples I use a $1000 deposit, 1.2% total risk, and x10 leverage. Planned loss on the whole idea is $12, but only if calculated liquidation sits beyond the set SL.
Total risk in $ = deposit × total risk in %
Risk per part in $ = deposit × risk of that part in %
Distance to SL = SL / entry price − 1
Notional per part = part risk in $ / distance to SL
Initial margin per part = part notional / leverage
Average entry = total notional / total token amount
0.4% + 0.4% + 0.4% is three parts of acceptable loss up to one overall SL. These are not three equal sums or three equal margins. The closer the entry to the stop, the larger the notional you can open at the same risk.
| Parameter | Value |
|---|---|
| Signal price | 0.065230 |
| Current price in message (−2.88%) | 0.063350 |
| Scaling zone | 0.063273–0.067187 |
| Upper zone boundary | 0.067187 |
| TP1 / 40% | 0.061642 |
| TP2 / 30% | 0.058707 |
| TP3 / 30% | 0.055445 |
| Overall Radar SL | 0.072562 |
| Total risk in example | 1.2% = $12 |
On the LA snapshot, from current price to SL is 14.54%. From signal price — 11.24%, from the upper zone boundary — exactly 8.00%. Always calculate exact distance from your actual fill price.
For the third automatic entry I use not the SL itself, but 60% of the distance from the upper zone boundary to SL:
E3 = 0.067187 + 0.60 × (0.072562 − 0.067187) = 0.070412
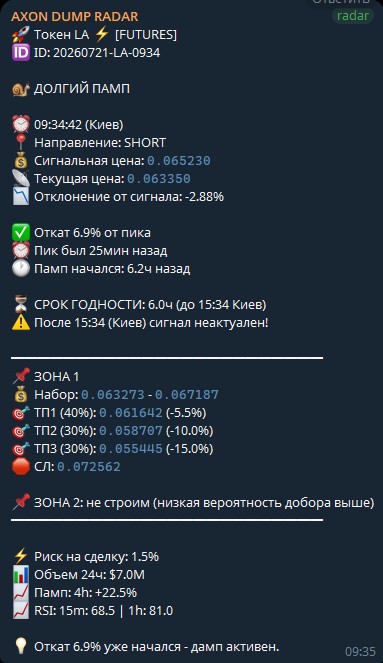
Strategy 1. Even risk: 0.4% / 0.4% / 0.4%
This is my base and most universal model. It keeps participation in a fast dump but doesn't give all the risk to the first price.
- First entry — at current price from the LA example, 0.063350. Risk 0.4% ($4).
- Second entry — at the upper zone boundary 0.067187. Another 0.4% risk ($4).
- Third entry — above the zone, 0.070412. Last 0.4% risk ($4).
- Overall SL — 0.072562. No new scale-ins after the third entry.
| Part | Price | To SL | Risk | Notional | Margin x10 |
|---|---|---|---|---|---|
| Entry 1 | 0.063350 | 14.54% | $4 | $27.51 | $2.75 |
| Entry 2 | 0.067187 | 8.00% | $4 | $50.00 | $5.00 |
| Entry 3 | 0.070412 | 3.05% | $4 | $131.00 | $13.10 |
| Total | Average 0.068613 | 5.76% | $12 | $208.51 | $20.85 |
After full scaling, the stop sits 5.76% from the average. Maximum loss is still 1.2% of deposit.
The third entry is not "now it will definitely drop." It's the last pre-planned piece of risk before the scenario cancellation boundary. If validity expired, price is at SL, Analyzer shows accelerating volume with rising price, or the chart shows vertical "candles" — I don't place the upper scale-in.
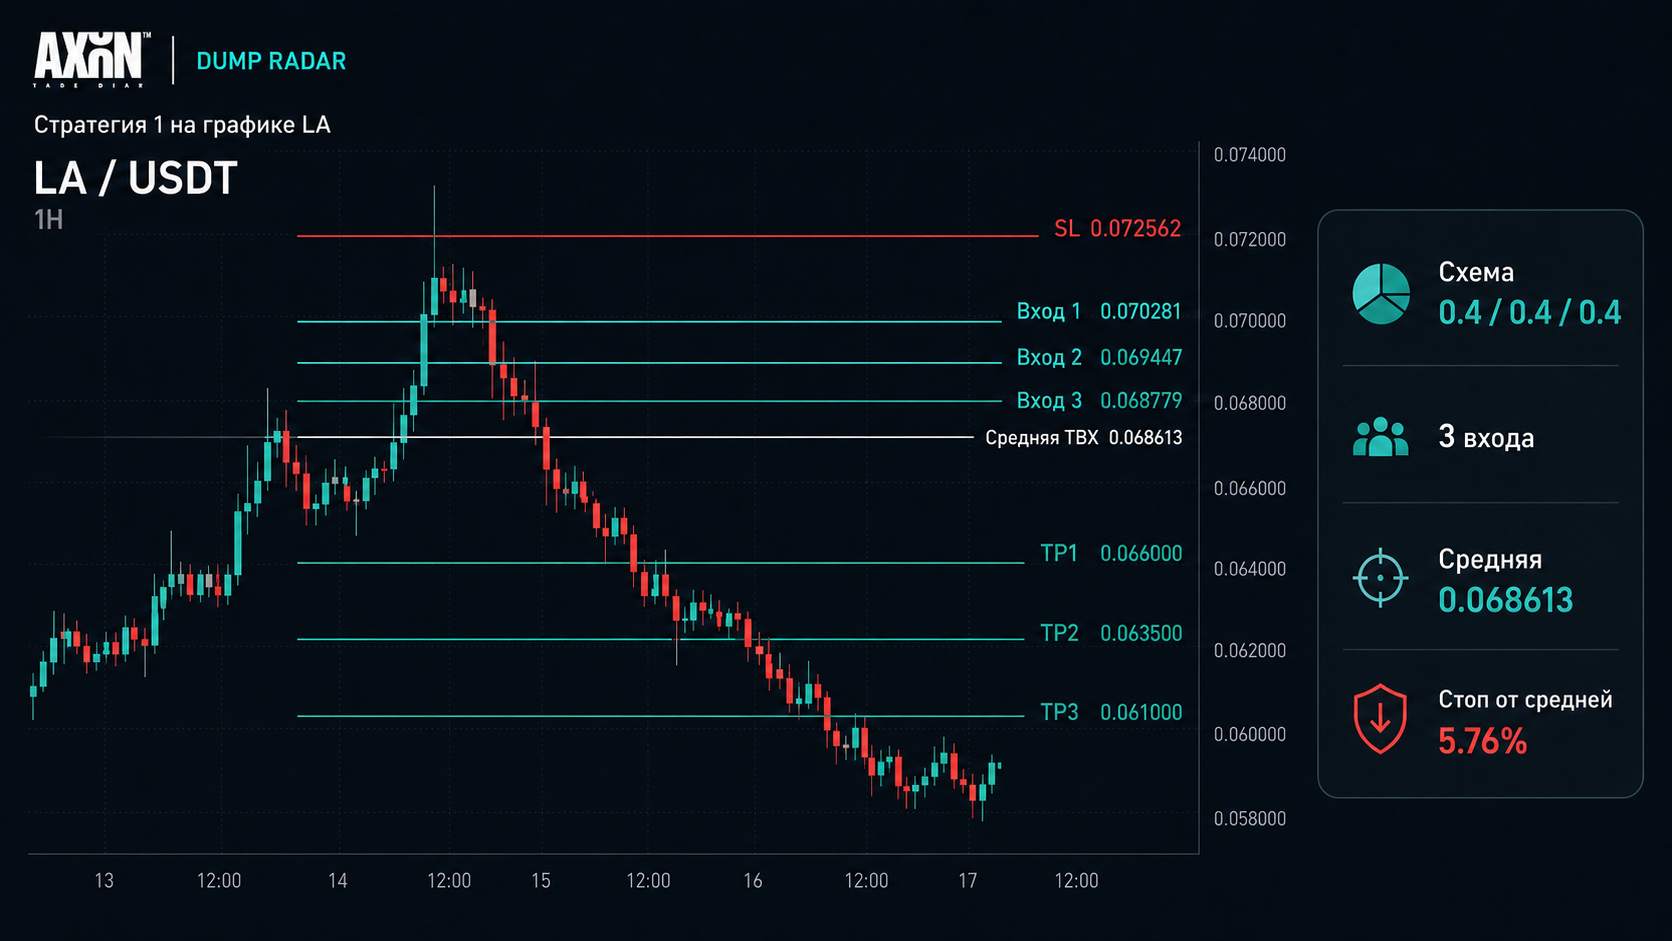
Strategy 2. Conservative scaling: 0.2% / 0.4% / 0.6%
The first position is deliberately small. We participate if the token drops immediately, but the main part of risk stays for the upper boundary and pump continuation.
| Part | Price | To SL | Risk | Notional | Margin x10 |
|---|---|---|---|---|---|
| Entry 1 | 0.063350 | 14.54% | $2 | $13.75 | $1.38 |
| Entry 2 | 0.067187 | 8.00% | $4 | $50.00 | $5.00 |
| Entry 3 | 0.070412 | 3.05% | $6 | $196.50 | $19.65 |
| Total | Average 0.069364 | 4.61% | $12 | $260.25 | $26.03 |
After full scaling, distance to SL is 4.61%. Trade-off: on an instant dump, profit is smaller. That's the price for scaling the main size substantially higher in a rare pump continuation.
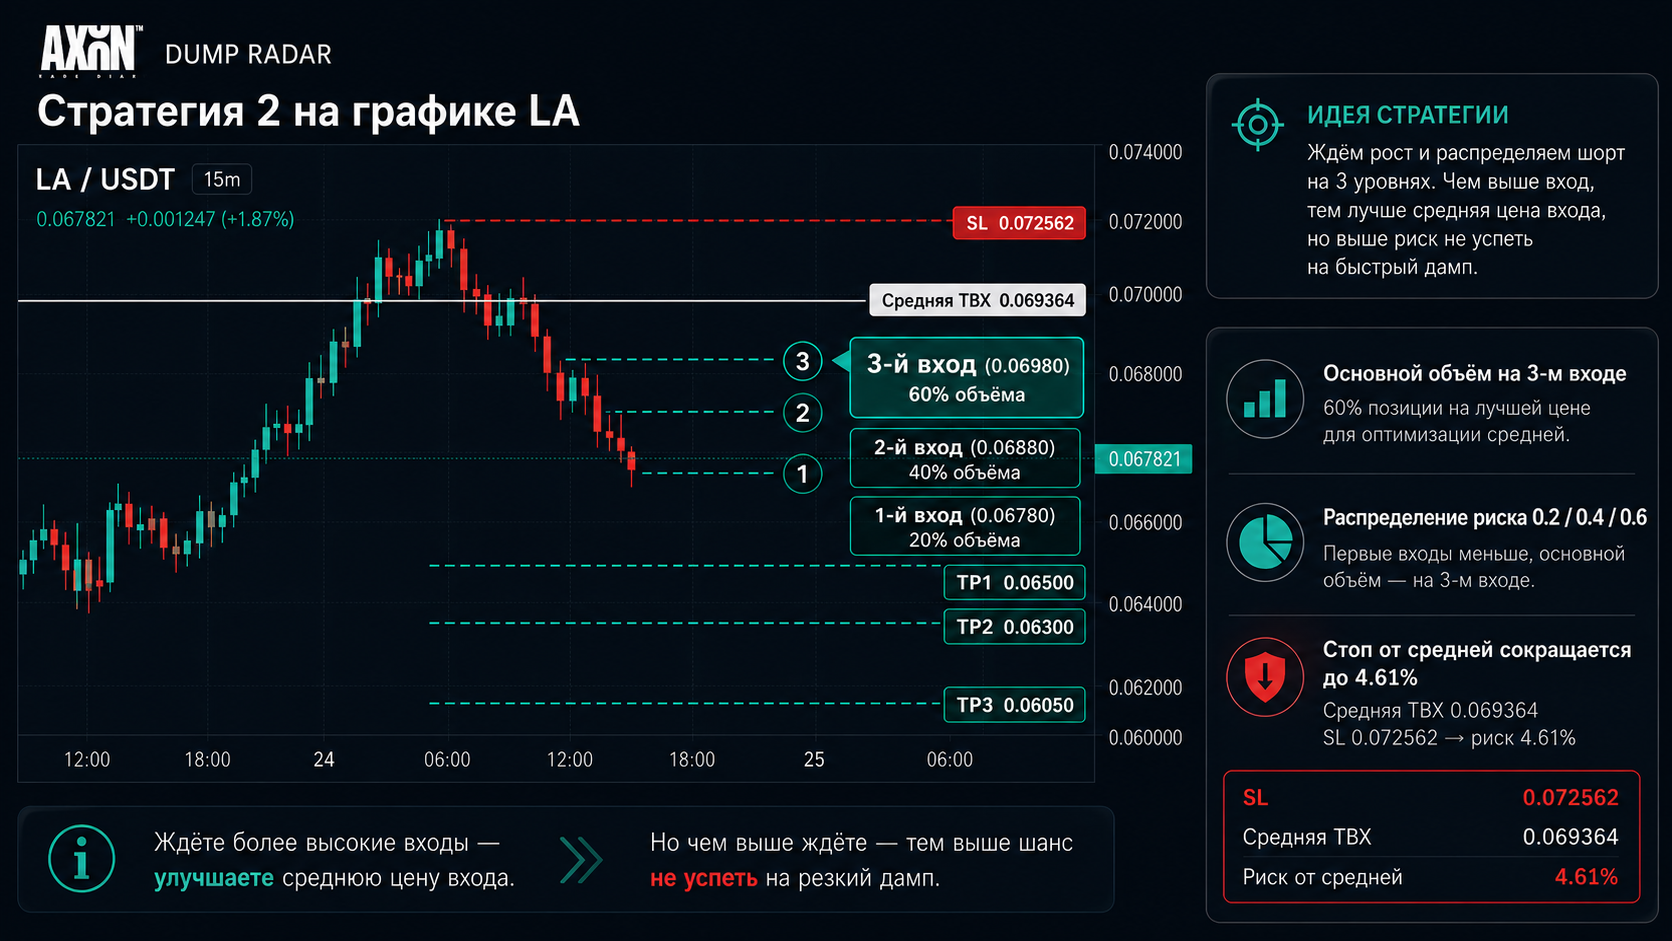
Strategy 3. Two attempts instead of one deep loss
The first attempt opens at 0.063350 with 0.3% risk ($3). Personal stop — slightly above the upper zone boundary:
Personal SL1 = 0.067187 × 1.005 = 0.067523 (≈6.59% from entry).
If the personal stop triggers, the loss is fixed at 0.3%. The remaining 0.9% is split across two higher entries:
| Part | Price | To overall SL | Risk | Notional |
|---|---|---|---|---|
| Entry 2 | 0.069337 (40% of way to SL) | 4.65% | $4.50 | $96.75 |
| Entry 3 | 0.070681 (65% of way to SL) | 2.66% | $4.50 | $169.07 |
| 2nd attempt total | Average 0.070186 | 3.39% | $9.00 | $265.82 |
This is not martingale: all $12 of risk is distributed before opening the trade.
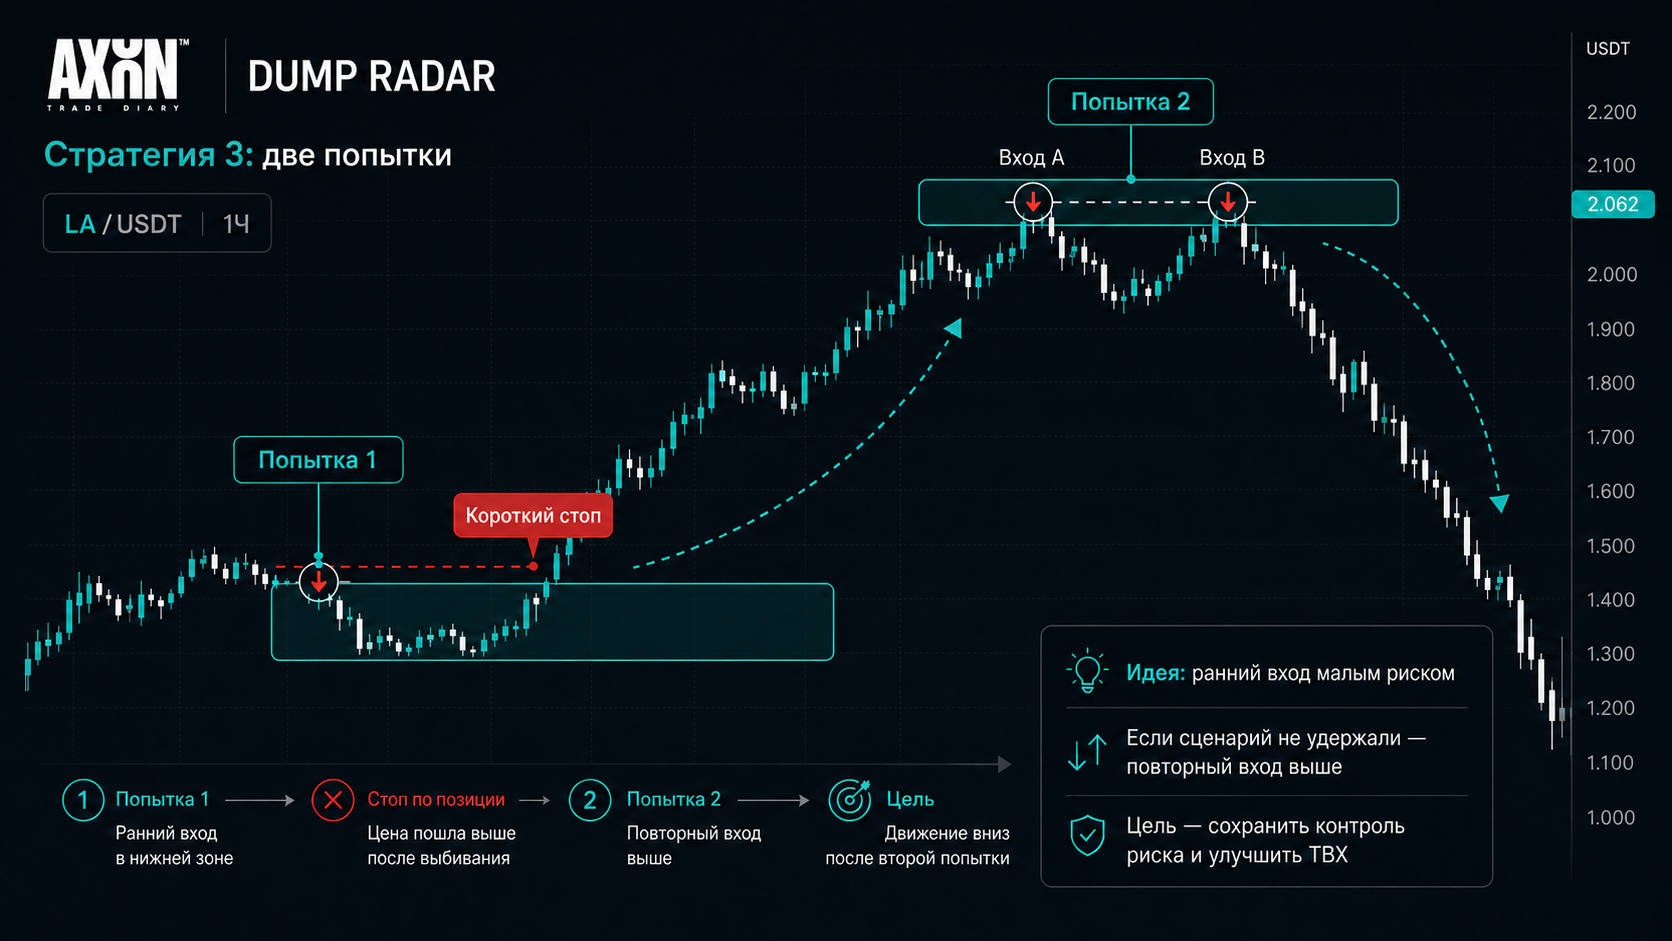
Strategy 4. Waiting for the upper average entry
The fourth model skips immediate entry. Some signals will pass without you. In exchange, you only work from the upper zone boundary / above it after a reaction.
Before a pending entry, check Ticker Analyzer: price is not rising right now, current volume is not accelerating, RSI and pump context hold, the main part of the dump is not yet taken, validity has not expired.
| Part | Price | Risk | Notional | Margin x10 |
|---|---|---|---|---|
| Entry 1 | 0.067187 — zone top | 0.4% = $4 | $50.00 | $5.00 |
| Entry 2 | 0.070412 — 60% of way to SL | 0.8% = $8 | $262.00 | $26.20 |
| Total | Average 0.069875 | 1.2% = $12 | $312.00 | $31.20 |
Stop from full average — roughly 3.85%. The most comfortable geometry, but also the highest chance of getting no position.
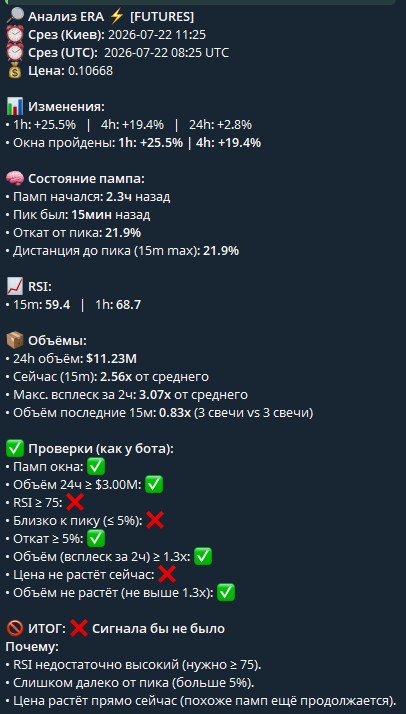
The ERA example shows the opposite: pullback from the peak is already large, RSI dropped, price is rising again. You can't open such a ticker just because it fit Dump Radar a few hours ago.
The green candle rule
While impulse accelerates — no short. Long green candles, new highs, and rising current volume matter more than any pre-drawn zone. The market must stop accelerating first.
Signs of return to the scenario: candle bodies shrink, upper wicks appear, new high doesn't hold, first red candle forms, price returns below a local level.
Taking profit across all four strategies
The scaling scheme changes; profit-taking stays the same.
| Level | What we do | What about the stop |
|---|---|---|
| TP1 | Close 40% of actually scaled position | Remainder near weighted average entry |
| TP2 | Another 30% | Last 30% at breakeven or by structure |
| TP3 | Last 30% | Trade complete |
Percentages are from actually filled size. On full scaling of Strategy 1 with all TPs on LA, it came to about +$29.51 / +2.95% deposit before fees (roughly 2.46R at 1.2% risk). That's example mechanics, not a promise.
Can you enter with full size at once
Yes. But you can't mix "I entered full size and calculated risk correctly" with "I entered my usual large sum and hope to survive the path to the stop."
On LA, entry at 0.063350 to SL 0.072562 — 14.54%. For loss to be $12, notional ≈ $82.52. At x10, initial margin is not enough to survive such an SL — you need lower effective leverage (roughly x4) or added Isolated margin. Cross pushes liquidation further but ties in more account balance.
If you open the same notional $208.51 and margin $20.85 at x10 in one entry from the bottom, theoretical PnL to SL ≈ −$30.32, and Isolated liquidates earlier. Same margin doesn't mean same risk.
Comparing the four models
| Model | Risk per entry | Stop from average on LA | Chance to miss fast dump | Who it fits |
|---|---|---|---|---|
| Even risk | 0.4 / 0.4 / 0.4% | 5.76% | Low | Most traders |
| Conservative scaling | 0.2 / 0.4 / 0.6% | 4.61% | Low, small first size | Beginners |
| Two attempts | 0.3% + 0.45 / 0.45% | 3.39% on 2nd | Medium | Those who prefer a tight stop |
| Upper average entry | 0 / 0.4 / 0.8% | 3.85% | High | Selective traders |
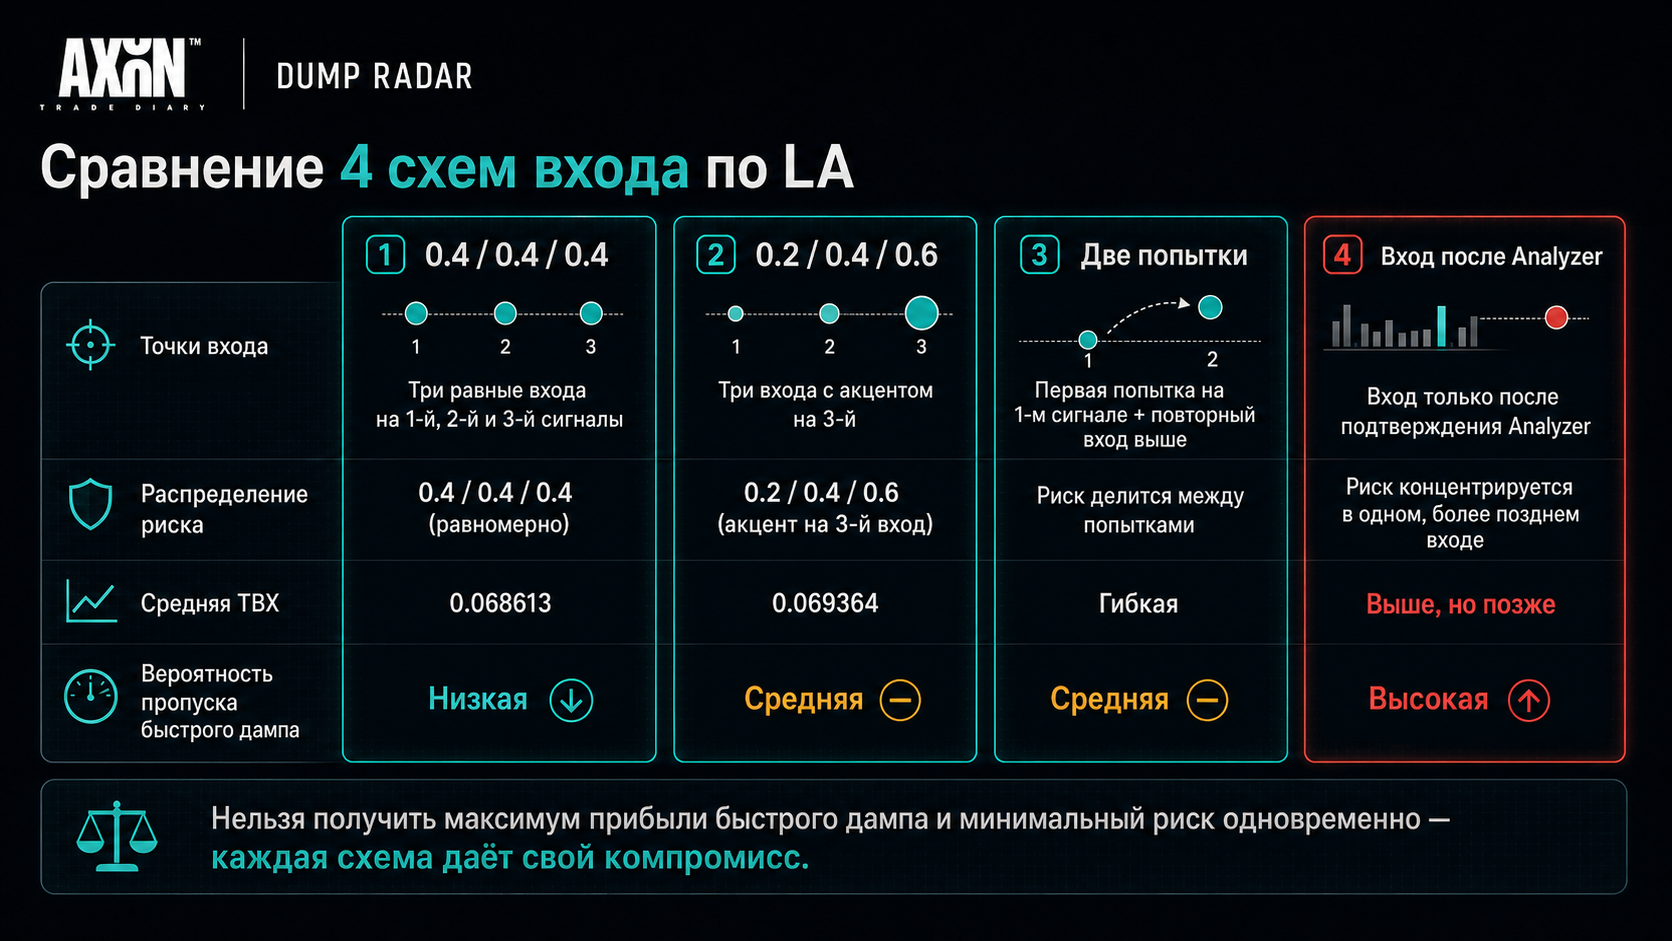
Pick one main model for at least 30–50 signals and keep a journal. You can combine strategies with a pre-set rule ("normal — even split, candles — two attempts"), but not inside one trade on emotion.
Summary
Dump Radar finds overheated movement and forms a scenario. But the bot doesn't know your deposit, drawdown tolerance, or willingness to skip a fast signal for a higher entry point.
My base model is even risk 0.4% / 0.4% / 0.4%. Beginners often fit shifting risk upward. More active traders — two attempts. Waiting for upper average entry — only if you can skip trades and check freshness through Analyzer.
Before any position, recalculate distance from your price to SL, notional, and leverage yourself. A Radar signal and examples from this article are not a command to enter.